 The Red River and its tributaries are home to an extensive stream monitoring network. These gauge stations provide valuable real-time stream flow data.
Savvy anglers can use these data to plan and adapt their fishing plans. Rising water usually indicates better fishing, but too much can impact access.
This data map from the U.S. Geological Survey provides at-a-glance updates on Red River Basin flows.

How to use
- Open the USGS water dashboard
- Using your mouse, scroll and zoom to your fishing location.
- Check river conditions for time of year:
- Blues: Above-average flow.
- Green: Average flow.
- Yellow/Red: Below average flow.
- Click on a given location, and a pop-up window will display a graph of recent flows.
- For some locations, the graph can toggle between flow and temperature. Additional data is sometimes available.
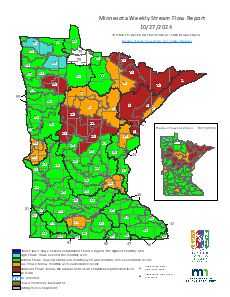
Minnesota DNR summarizes stream flow conditions statewide and produces easy-to-interpret maps of recent flow conditions.

How to use
- Open the DNR weekly streamflow map
- The default is the most recent map. Click "Get MAP" button.
- Map will display flow conditions by watershed:
- Blues: Above-average flow.
- Green: Average flow.
- Yellow/Red: Below average flow.
Minnesota DNR provides a map interface that shows stream gauge reports from the U.S. Geological Survey, DNR and the Minnesota Pollution Control Agency.

How to use
- Open the CSG map
- Zoom to a desired location by:
- Moving the map by clicking and holding the left mouse button and using your mouse's wheel to zoom in or out.
- Clicking the "Filters" button and selecting criteria.
- Map will display flow conditions by watershed:
- Blues: Above-average flow.
- Green: Average flow.
- Yellow/Red: Below average flow.
- Clicking on a marker will show data in a pop-up window and display clickable icons at the bottom that allow additional actions, including downloading data from up to 10 selected sites.

